WAS-Mortgage Bankers Association (MBA) looks not as bad as it seems
The Weekly Applications Survey, produced by the Mortgage Bankers Association (MBA), yesterday offered bad news on the headline ("Mortgage Applications Decrease in Latest MBA Weekly Survey") but a mixed message for those interested in a fuller read. I suppose that’s what you have me for.
The Mortgage Bankers Association’s weekly report of mortgage activity showed another decline. Last week’s data produced a decline as well, which came even despite improved mortgage rates. This week, a sharp spike in mortgage rates drove down refinancing activity and the overall metric. We suspect this nascent rising rate trend from a June trough could also be behind last week’s drop in mortgage activity, as the interest rate data are derived by a simple average of contracted fixed rate mortgages.
The rise in rates likely began during the prior week period and affected activity then as well. Several resources we surveyed for daily mortgage rate trends turned up short (Freddie Mac (FMCC.OB)) of enough data. While a decline in average contracted rates defined the period, where the weekend fell and other factors might still skew activity in a dynamic rate environment.
This week’s reported data reflects the period ending July 1. The MBA’s Market Composite Index fell 5.2% through the week, driven by refinancing fizzle. The Refinance Index declined 9.2%, as mortgage rates spiked higher. Average contracted rates on 30-year and 15-year fixed rate mortgages increased to 4.69% (from 4.46%) and 3.79% (from 3.64%), respectively. For those contemplating mortgage refinancing, that kind of change is a real turn-off.
Here’s the good news for the patient among you
The MBA’s Purchase Index, which measures mortgage applications tied to the purchase of a home, rose 4.8% against the immediately preceding week on a seasonally adjusted basis. Considering the direction of mortgage rates, it would seem there may be some pent-up demand in the housing market chasing rates now. After all, the same change in rates had two different impacts on the two different segments of the market, if it had any impact on the more determined purchasers of homes at all.
There was more good news for real estate enthusiasts found in the year-to-year comparison. The Purchase Index was up 11.7% versus the year ago period. Last week, we saw the Pending Home Sales Index achieve year-over-year growth and home price rise as well; and so we called the bottom for the real estate market. This latest year-over-year trend seen now in many data-points should also show up when second half Existing Home Sales data reach the wire. Recall that the Pending Index measures contract signings, and that closures occur one to two months afterward. This latest mortgage application data seems to offer evidence that housing is finding momentum, because it reflects applications for the purchase of homes sought in late June.
The one caveat we have is that last year’s comparable period now also reflects a deflated market that saw demand drawn forward by the tax-incentive provided by the federal government for first time buyers. Still, I believe natural drivers will allow for housing market growth thereafter. We remind readers that all bets are off if the American government drops the ball on the debt ceiling legislation, or even if the euro-zone blows up or, some other catastrophe presents itself. Otherwise, there are natural drivers such as population growth, net job creation and housing affordability that should not be ignored when one gets too comfortable with the latest days’ real estate malaise.
A common sense of landing supply and house pricing
Economics 101
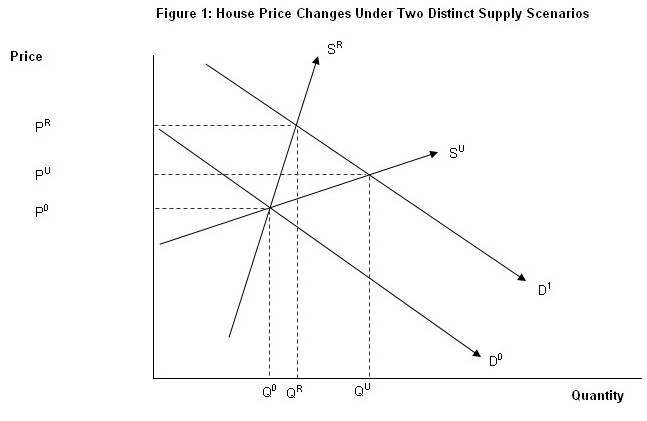
The economic forces underpinning the above findings are perhaps best explained through basic supply and demand analysis. Consider the below chart on this issue.

Q0 and P0 represent the initial equilibrium situation in the housing market. Initial demand is provided by D0, whereas supply is shown as either SR (restricted) or SU (unrestricted), depending on whether land supply constraints exist.
Following an increase in demand, such as that brought about by a significant relaxation of lending standards, the demand curve shifts outwards from D0 to D1. When land supply is restricted, house prices rise sharply from P0 to PR. By contrast, when supply is unrestricted, prices rise more gradually from P0 to PU.
The situation works the same way in reverse. For example, if there was a sharp fall in demand following a contraction in credit availability or a sharp rise in unemployment, causing demand to fall from D1 to D0, then prices fall much further when land supply is constrained.
The key point is that increases (declines) in demand can bring sharply rising (falling) house prices when supply is constrained. However, when land supply is not regulated, it adjusts to demand and house price volatility is reduced.
The economic forces underpinning the above findings are perhaps best explained through basic supply and demand analysis. Consider the below chart on this issue.
Q0 and P0 represent the initial equilibrium situation in the housing market. Initial demand is provided by D0, whereas supply is shown as either SR (restricted) or SU (unrestricted), depending on whether land supply constraints exist.
Following an increase in demand, such as that brought about by a significant relaxation of lending standards, the demand curve shifts outwards from D0 to D1. When land supply is restricted, house prices rise sharply from P0 to PR. By contrast, when supply is unrestricted, prices rise more gradually from P0 to PU.
The situation works the same way in reverse. For example, if there was a sharp fall in demand following a contraction in credit availability or a sharp rise in unemployment, causing demand to fall from D1 to D0, then prices fall much further when land supply is constrained.
The key point is that increases (declines) in demand can bring sharply rising (falling) house prices when supply is constrained. However, when land supply is not regulated, it adjusts to demand and house price volatility is reduced.
Subscribe to:
Posts (Atom)